[Case 01]
Financial Transparency Hub
Education
Financial Transparency Hub
Helping Students Understand Where Their Tuition Goes
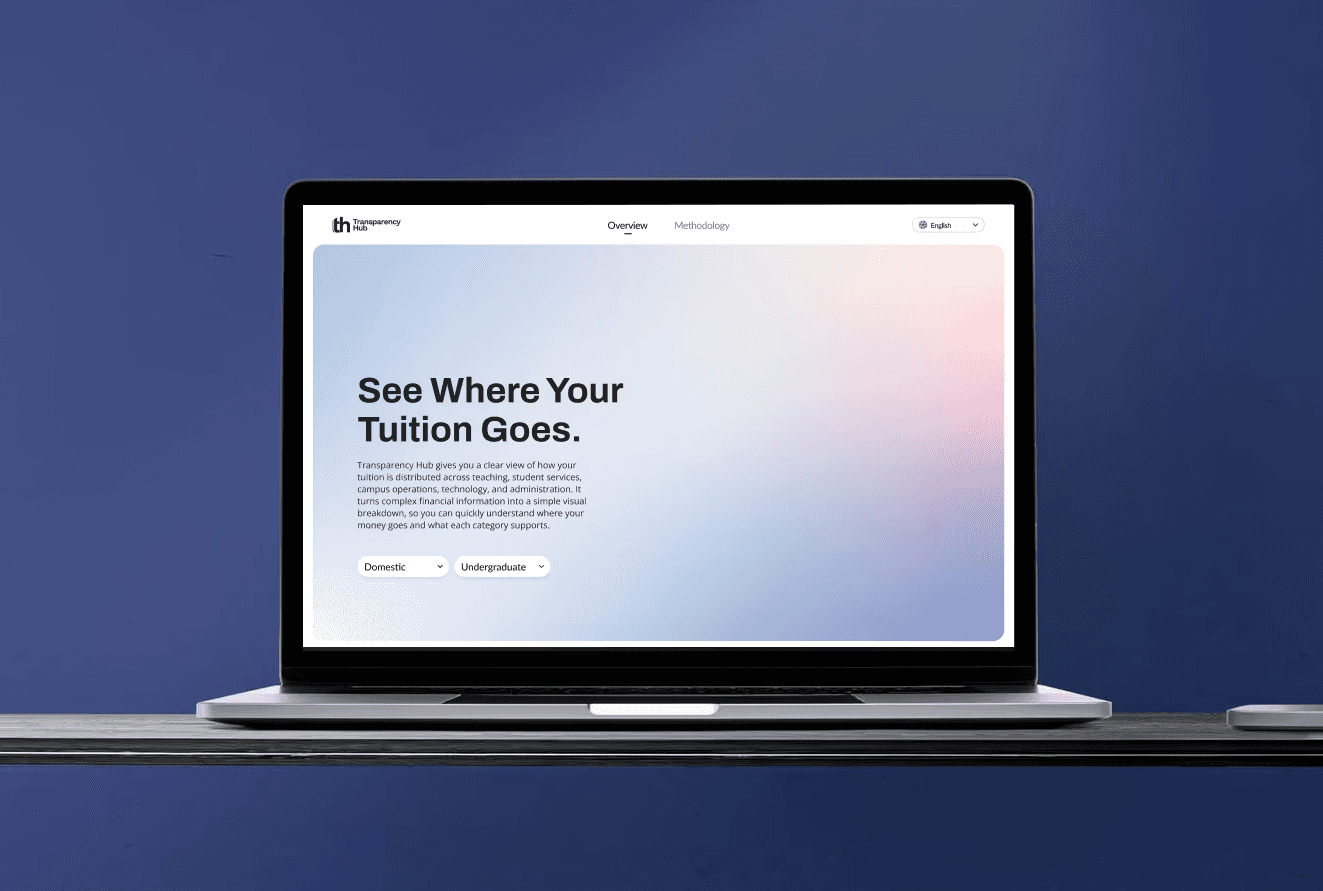
[Project Overview]
A web platform that helps students quickly understand where their tuition goes. It presents financial information through clear visuals, plain-language explanations, and a centralised structure.
[Problem Statement]
Students struggled to understand tuition allocation because the information was fragmented, jargon-heavy, and difficult to navigate. The issue was not missing data, but poor accessibility and unclear communication.
[Industry]
Education
[My Role]
Lead UX Researcher
[Platforms]
Web (Desktop-first)
[Timeline]
Oct 2025 – Dec 2025
[Persona]

Li Hua
University Student
I’m a third-year CS student at UTSG and need a clear way to understand where my tuition goes without digging through complex information.
Age: 21
Location: Toronto
Tech Proficiency: Advanced
Gender: Male
[Goal]
Understand where tuition goes in under 10 seconds
Get plain-language term summaries
Share breakdown with family who don't speak english
[Frustrations]
Dense reports full of jargon
Unclear link between tuition and outcomes
Financial terms are confusing and unclear
[Process]
[01] User Research
Conducted a 62-response survey and 12 interviews to understand how students access and make sense of tuition information.
Synthesised findings through thematic analysis, affinity mapping, personas, and an as-is scenario.
Used a prioritization grid to turn research into focused feature directions.
[02] Insights
Users are overwhelmed by how information is presented, not by the amount of information
Users want simplified, high-level explanations before detailed breakdowns
Trust is affected when information feels inaccessible or overly complex
[03 Design Solution]
Added plain-language tuition breakdown
Added clickable category tiles to show exactly where each fee goes
Added a language toggle for international students and their families
[04] Testing & Iteration
Conducted guerrilla usability testing with 3 students using low-fidelity storyboards.
Conducted think-aloud sessions on a clickable Figma prototype, noting confusion points.
Refined pie chart labels, filter states, and added a shareable summary based on feedback.
[Outcome]
71% of testers immediately understood the platform’s purpose
86% improvement in understanding tuition allocation
Clearer labels and methodology cues improved perceived transparency and trust
[Key Learnings]
Clarity drives trust
Users feel excluded when information is difficult to interpret, even if it is technically available.
Structure > content
The problem was how information was organized and accessed.
Research informs design
Translating insights into concrete features ensures the product actually solves user problems.